React & HTML Canvas
It is no secret that I’ve been volunteering time with Exercism for some time. It has been a great way to get deeper working with Elixir. In the last 9 months or so, I’ve been helping them work towards their next version, “V3”. V3 is going to be awesome when it is complete, a very different take on learning a programming language. So while working on the elixir content for v3, I wanted a way to visualize how the exercises worked together. So I hacked together this on codepen with D3.js:
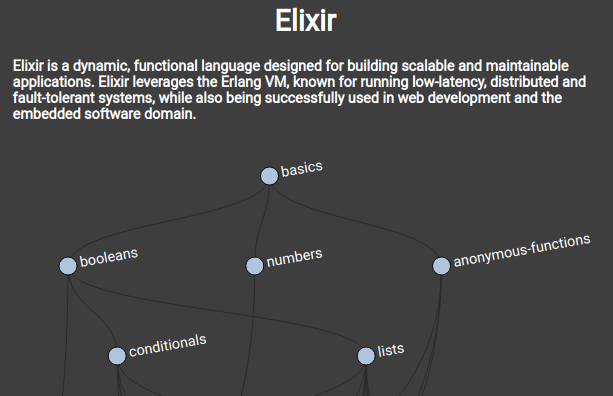
Build with D3 on Codepen
D3 provided some interesting functions to work with SVG in a declarative way, so was awesome to be able to visually verify the progression from beginning exercises to later ones. Some people liked this and so I volunteered to port it to the group dashboard, so I rewrote it as a hybrid D3/React-Typescript component (while learning typescript from Derk-Jan):
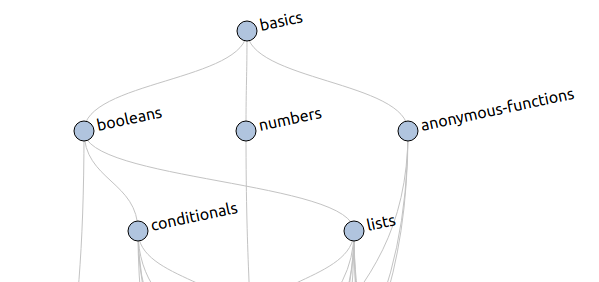
Build with D3 in React-Typescript SPA
From these experiences, I can say that I really like working with SVG. It always looks crisp and beautiful no matter the size. It is easy and declarative to get reproducible results. However, i did find that it has some limitations:
- When I wanted my graph to be responsive to different browser widths/mobile, I had to handle the resizing by hand.
- When I wanted to attach events to regions, I discovered that SVG mouse events are not the same as HTML mouse events.
So when I volunteered to create a similar type of graph for “V3” I has some goals in mind:
- I wanted to leverage responsive technologies, like css flexbox, to handle the heavy lifting
- I wanted to leverage css, to make it designer friendly, because while I think I have an eye for what looks good, I am not a graphic designer.
- I wanted to use SVG or HTML Canvas for the connecting paths.
So like any good DIY article, here is what it looks like (Design credit to Taiyab Raja, I translated it to react):
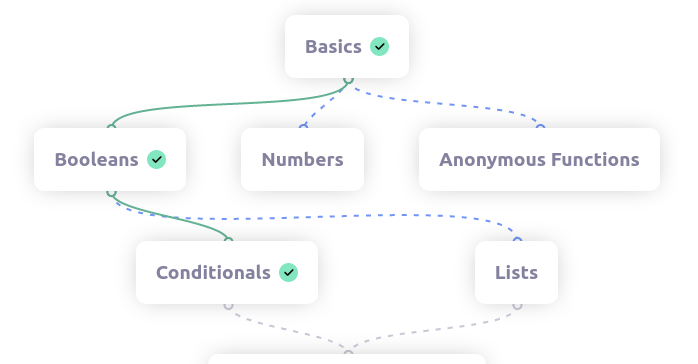
React, HTML Canvas
And this is how it behaves:
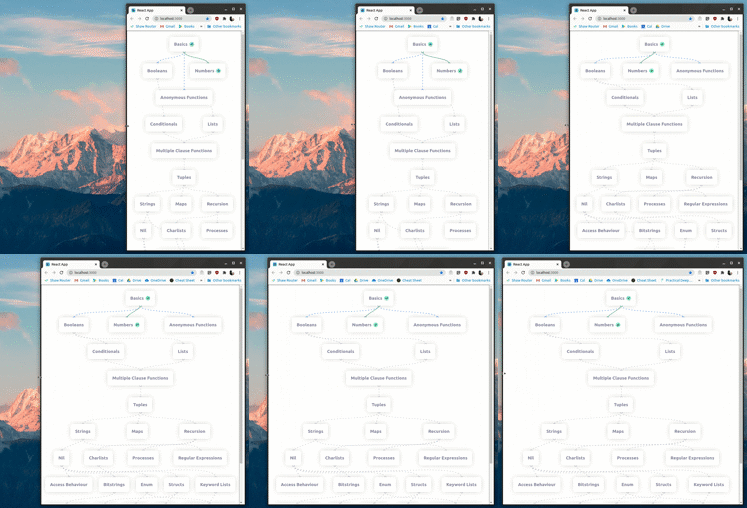
Oooooooo, pretty! 🤩
Structure
So this a parent component <ExerciseGraph /> (written with React Hooks) and two children components <ExerciseConnections />, <Exercise /> that just needs some data passed down via params:
<ExerciseGraph
  exercises={data.exercises}
  layout={data.layout}
  connections={data.connections}
/>
So the heavy lifting is done by another service, (but very similar in function to the code on codepen), but it determines the structure of the graph with the nodes and edges to display. Let’s focus on 3 neat things about this graph:
- Responding to the webpage size
- Bezier Curves
- Drawing the paths
Reponding to Webpage (re)size
Responding to the window size is done through a custom useWindowSize hook, which provides the window’s current size and updates when it changes:
export function useWebpageSize() {
  const [webpageSize, setWebpageSize] = useState({
    width: undefined,
    height: undefined,
  } as WebpageSize)

  useEffect(() => {
    function handleResize() {
      setWebpageSize({
        width: document.documentElement.clientWidth,
        height: document.body.scrollHeight,
      })
    }

    window.addEventListener('resize', handleResize)
    handleResize()

    return () => window.removeEventListener('resize', handleResize)
  }, [])

  return {
    width: webpageSize.width ?? 0,
    height: webpageSize.height ?? 0,
  }
}
This custom hook uses the useEffect hook to run when it is mounted. It attaches an event listener on to the window, which then updates the state via the useState hook. The updated state is then returned to components that use the hook:
// These will contain the newest width and height when used by a component
const { width, height } = useWebpageSize()
Bezier Curves
Bezier curves are defined by parametric equations – they can use many points to define a curve, but often cubic bezier curves are common in HTML and CSS. Cubic Bezier curves have two control points that define the curve.
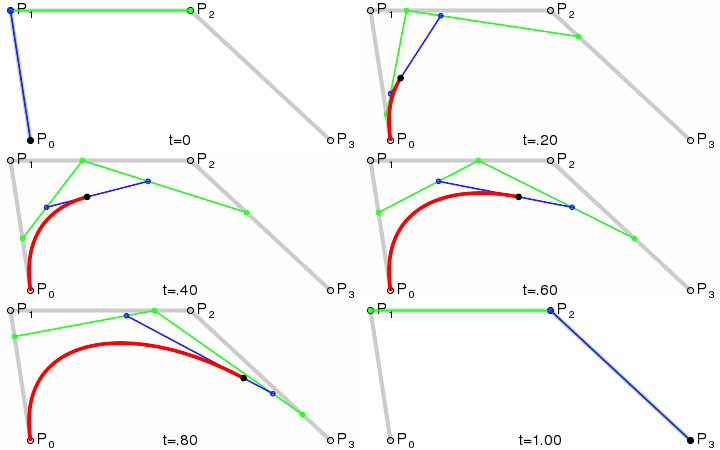
Credit to Phil Tregoning via Wikipedia
The curves in the graph are defined similarly. The distance between the starting point (P0) and control point (P1) relate to how extreme the curve is.
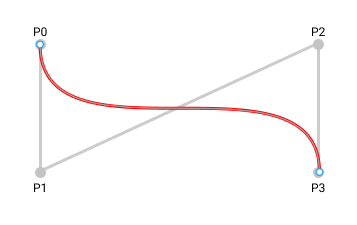
So to vary the paths so they don’t exactly overlap, the control points in the graph vary their position in relation to how far the prerequisite exercise is from the following exercise.
Drawing the paths
So the choice was between SVG and HTML Canvas. A reason I went with a canvas is that I could easily programmatically create the paths with vanilla JS, not having to use an external library. With HTML canvas, once you have the 2d drawing context it is just a few functions to define a really neat set of paths:
// Draw the line
ctx.beginPath()
ctx.moveTo(start.x, start.y)
ctx.bezierCurveTo(
  start.x,
  start.y + controlPointOffset,
  end.x,
  end.y - controlPointOffset,
  end.x,
  end.y
)
ctx.stroke()

// Draw Start Dot
ctx.beginPath()
ctx.arc(start.x, start.y, radius, 0, 2 * Math.PI)
ctx.fill()
ctx.stroke()

// Draw End Dot
ctx.beginPath()
ctx.arc(end.x, end.y, radius, 0, 2 * Math.PI)
ctx.fill()
ctx.stroke()
Combined it makes a great result! Normally you would have to erase the contents of the canvas to draw on it, but because react is redrawing the element, it is a blank canvas each time it mounts.